Wednesday, April 24, 2013

Visualizing a lot of FMO PIEDA numbers. Part II

In the last post on the subject of FMO PIEDA numbers, there were some issues with the fragmentation that did not match between two different snapshots in the same reaction trajectory.

I fixed that fragmentation problem, ran the numbers again and it looks like some neat stuff can be extracted.

Remember that the structures are generated using PM6 with MOZYME enabled and that energy-refinement of the barrier is done at the FMO2/6-31G(d)/PCM level of theory. The CON structures have some part of the structure constrained (far away from the active site) and the UCO structures are allowed to fully relax. The problem still looks like this


To tease you with some data, here is a table from a short write-up I did. Column two and three represents the difference in energy (by the method in the first column) between the TS and the reactant. The last column is the energy difference between column two and three. The first row is thus the difference in sum of one-body energies, second row is difference in the sum of fragment interaction energies (FIEs) and the last row is the difference in total FMO2 energy.

dE(1,5)_con dE(1,5)_uco ddE(uco-con)
FMO1-MP2/6-31G(d)/PCM 25.4 29.4 4.0
$\sum_{IJ} \Delta E^{MP2}_{IJ}$ -3.7 18.6 22.4
FMO2-MP2/6-31G(d)/PCM 25.9 55.0 29.1

The one-body case is a solved case because inspection reveals that the internal energies of the substrate contributes +3.5 kcal/mol, ASP119 contributes +5.3 kcal/mol and ASN35 contributes -4.3 kcal/mol which when summed up is roughly the 4 kcal/mol we need. The rest is just internal re-arrangement that eventually cancels out.

The problem with the barrier height, however, is that at the two-body level (second row), the CON structures provide almost 4 kcal/mol worth of stabilization whereas the UCO structures are destabilized by 18.6 kcal/mol. It would be natural to investigate what happens if we look at the FIEs between the substrate and the entire enzyme. This looks like the following


what is curious is that we see distinct peaks - the largest (positive) peak can be attributed to an interaction with ARG112, but if we sum all IEFs up they amount to +0.5 kcal/mol which is very far from the +18.6 we are trying to account for. The conclusion is (currently) that because the protein is allowed to fully relax, many small contributions amount to the 18.6.

credits to this sites table-generator because I lost all my HTML skills whilst fighting FORTRAN

Tuesday, April 16, 2013

DALTON mol File Input Generator for Open Babel

Because of my new engagement with DALTON, I felt there was a serious lack of availability in the open source tool chain that I am used to: There is no input file generator in Open Babel for DALTON, until now.

Through a series of commits in my own fork of the official Open Babel repository, I've added a basic mol file input generator (and reader too!). The commits have been marked with a pull request to be merged into the official repository, but it looks like it is only updated every now and then. If you want to get all crazy right away, clone my repository and get cracking.

Experienced users with DALTON knows that there are two input files. the molecule file and the DALTON input file (dal file). The mol file contains the coordinates of the atoms, their charge and the basis set for the computation. The dal file tells DALTON what to actually do with the content of the mol file. Thus, the dal file is about the quantum chemistry which is traditionally left out in Open Babel and I've only focused on getting the mol-file ready - most users of DALTON use a single dal file anyways and use different mol files. I guess my own scripts to make easy conversions to and from DALTON are now void (at least partially).

Hooray for Open Source!

Addendum: I should mention that coordinates can also be extracted from DALTON log files. As I myself do not (usually) have a need beyond coordinate extractions I will leave it as is for now.

Wednesday, April 10, 2013

NMR shielding constants through polarizable embedding. Part II

In my previous post on the subject of NMR shieldings in polarizable embedding, some progress has been made.

Through the polarizable embedding (PE) approach, calculating gauge-independent magnetic properties in the electrostatic field of the surroundings is now possible. Currently, the PE approach supports an electrostatic multipole expansion up to (and including) order 5, where order 0 is a charge, order 1 is a dipole and so on. The magnetic properties can now be calculated with contributions from quadrupoles (order 2), but we expect to finish the rest of the contributions once some development time is available from the Gen1Int-developers.

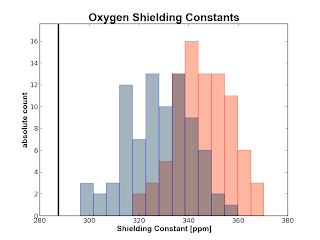
If you have a water cluster and you calculate the shielding constants for the Oxygen and the Hydrogens of the central water molecule with some surrounding water molecules also treated with quantum mechanics, you can now obtain plots like the following


The plots are obtained from 50 snapshots from an MD of water in water. The black vertical line is the experimental number obtained from a (somewhat) recent paper by Kongsted et al. The red histogram is made from numbers calculated at the B3LYP/pcS-0 level of theory whereas the blue histograms are calculated on the same geometry with B3LYP/pcS-1. The gray color in the oxygen plot around the experimental value depicts the uncertainty in that result.

Since this is not going to be a paper on benchmarking your top 20 functionals with your top 5 basis sets, we will from now probably use the KT3 functional with some flavour of the Frank Jensen pcS-n basis sets.

edit 1: Updated the plots to show transparency so you can see both distributions.

edit 2: Added the following based on feedback in the comments to the original post

Janus Eriksen suggested using KT1 or KT2 instead of KT3 since we were only interested in shielding constants. I personally think that Magnus wrote a reasonable response indicating that the difference in using KT1, KT2 and K3 is likely less than 1 ppm in error, but the switch from B3LYP would likely decrease the error by about 13 ppm.

Anders Steen Christen had a valid point in suggesting that we cannot really use the MD-simulations to compare to experiment because the shielding tensors are extremely sensitive to the geometry of the water molecules. Since I haven't really written anything about what we actually aim to do with the data in the end, the point is moot in that respect, but it is a strong point. Perhaps Coupled-Cluster based MD would be the right thing to do.

I would say that this really proves the strength of blogging about your ideas and getting input from others.

Monday, April 8, 2013

Visualizing a lot of FMO PIEDA numbers. A Preliminary look.

I've assisted in calculating some energy refinements using FMO2-MP2/PCM/6-31G(d) on top of a colleagues proposed trajectory calculated using PM6//MOZYME for part of the reaction step of Bacillus circulans xylanase. Two versions of this path was produced. One with constraints on some part of the structure (CON) and one without constraints (UCO). They are shown here


This FMO2 barrier is quite unrealistic, especially the unconstrained one so what is cause this large reaction barrier?

To investigate this, we are trying to run some PIEDA calculations to figure out which pairs are interacting strongly (and perhaps differently). PIEDA gives you an energy decomposition analysis of the individual pairs in an FMO calculation. So we get electrostatic contributions, exchange-repulsion, charge-transfer (and what is left), dispersion and solvation energy too.

The BCX-system we are looking at currently has 302 fragments (a total of 3172 atoms) which is actually the whole protein and its substrate. That means you get 45451 unique pairs and each pair is decomposed into five different terms giving you a wonderful 227255 numbers you have to visualize somehow. I haven't really figured out how to do this in a nice way, so instead I will plot the the total interaction energies between each unique pair of fragment for snapshot 2 and 3 for the blue curve (UCO) in the above graph.

I discovered the problem ... the fragmentation was not exactly the same along the entire UCO path which of course will make everything break down. Back to the drawing board then. What gave it away? Look here at the difference in pair-energies between frame 0 and frame 5 (click to see it in its full size - hell even that does not justify it)


So there it is. An unrealistic result can be your own fault no matter how hard you actually try to convince yourself that you used the same scripts for both runs.


Sunday, April 7, 2013

Building the OpenChemistry Packages on Ubuntu 12.04

Inspired by the latest Google+ posts by several of the developers of Avogadro (+Marcus Hanwell, +David Lonie, +Open Chemistry) I decided to install what is now known as Avogadro2 along with several other Open Chemistry packages.

The first step was to get hold of the sources which proved to be easy.

Second step was to compile which was also quite easy because the new cmake scripts downloads the correct packages you need (clever!). However, on my Ubuntu 12.04 I had to install the following extra packages to get rolling - my approach was to just see what failed and install what was missing.

sudo apt-get install libxt-dev
sudo apt-get install libqt4-opengl-dev
sudo apt-get install libbz2-1.0 libbz2-dev libbz2-ocaml libbz2-ocaml-dev
sudo apt-get install libqt4-dev qt4-dev-tools libqt4-webkit libqt4-core libqtwebkit-dev qt4-designer

Now, I haven't run the make install part of the whole shebang yet, but I have been able to run the new Avogadro application directly from the build directory so at least everything seems to compile fine. I was very inspired by the post on python input generators by David Lonie. Maybe I'll cook something up some day.

For now, it seems that Avogadro2 is a step back in terms of what you can actually do, but it also appears the developers are hard at work actually getting the application up to speed and ready for a beta-release very soon. I know I am excited.

Monday, April 1, 2013

Extending FragIt for Molecular Fragmentation with Conjugate Caps


As the co-author of FragIt(web, code), a piece of software written in Python using the Open Babel API, to help setup and fragment large molecules in fragment based methods, I have to return to this (excellent) piece of software to make it work with Molecular Fragmentation with Conjugate Caps (MFCC) methods which is the approach that my new work-place has taken as their method of choice in fragment based methods. Currently, FragIt only (officially) supports the Fragment Molecular Orbital (FMO) method.

Step I of this transformation is to realize that FMO and MFCC are two very different beasts. While the theory of FMO is more hairy, the information that FMO needs to run is vastly less than MFCC. In FMO, you specify pairs of atoms between which you wish to fragment and then everything goes along nicely whereas in MFCC you build fragments, attach caps and build extra fragments from those caps (called conjugate caps). The latter is very tough to do generally which is the approach and idea of FragIt in the first place: Mostly because getting the correct SMARTS you need is very cumbersome. As with the previous approach of FragIt, I'll make it work for proteins by selecting the appropriate SMARTS and program it in such a way that extensions to other systems would be straight-forward by simply figuring out additional patterns.

Right now my approach is to build “capping”-SMARTS that select atoms around places of fragmentation and build those caps in Open Babel. Non-trivial task is non-trivial I must admit.

Stay tuned as I explore the SMARTS and code needed to accomplish this.